")
")
")

")
Monitoring and control system KOMORSAN 2


KOMORSAN is a modern multi-module software that combines grid monitoring, control and management functionality. Working as Fault Management mini-SCADA, it ensures that every power grid node and emergency process is monitored and effectively managed.
KOMORSAN is an additive system allowing to expand its scale and functionality together with the growth of on-site fault management infrastructure. This allows optimizing the financial investment through the gradual development of the system.
Benefits:
|
|
Integration to any SCADA system (IEC104) |
|
Improved visualization of fault location. Alerts via sms and e-mails |
|
|
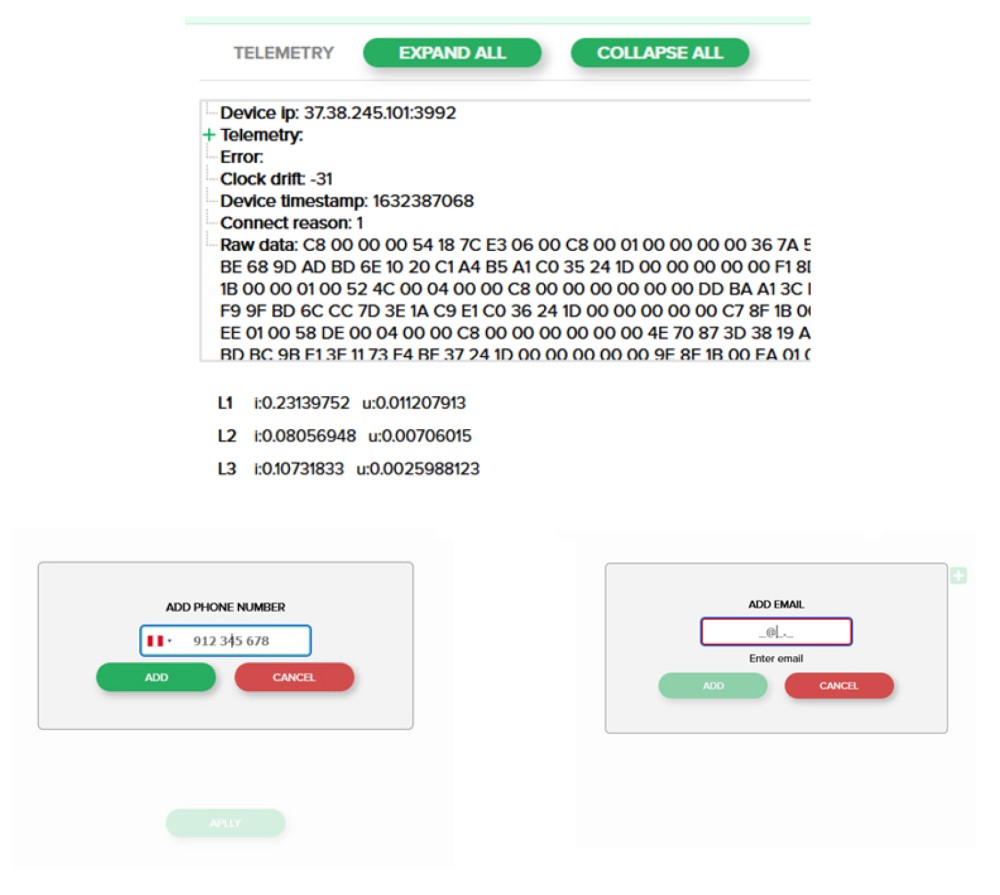
Telemetry collection |
|
Immediate detection of the damaged section |
|
|
Extended ACS Engineer mode |
|
Logging of personnel actions |
KOMORSAN System collects, analyzes and displays data obtained from the monitoring and control devices, equipped with communication modules, in real time mode, as well as controls breakers and disconnectors of overhead electric lines. Depending on the requirements of a particular power system, various network monitoring and control devices: fault current indicators, disconnectors and breakers, icing temperature sensors, etc may be included in the KOMORSAN 2 system.
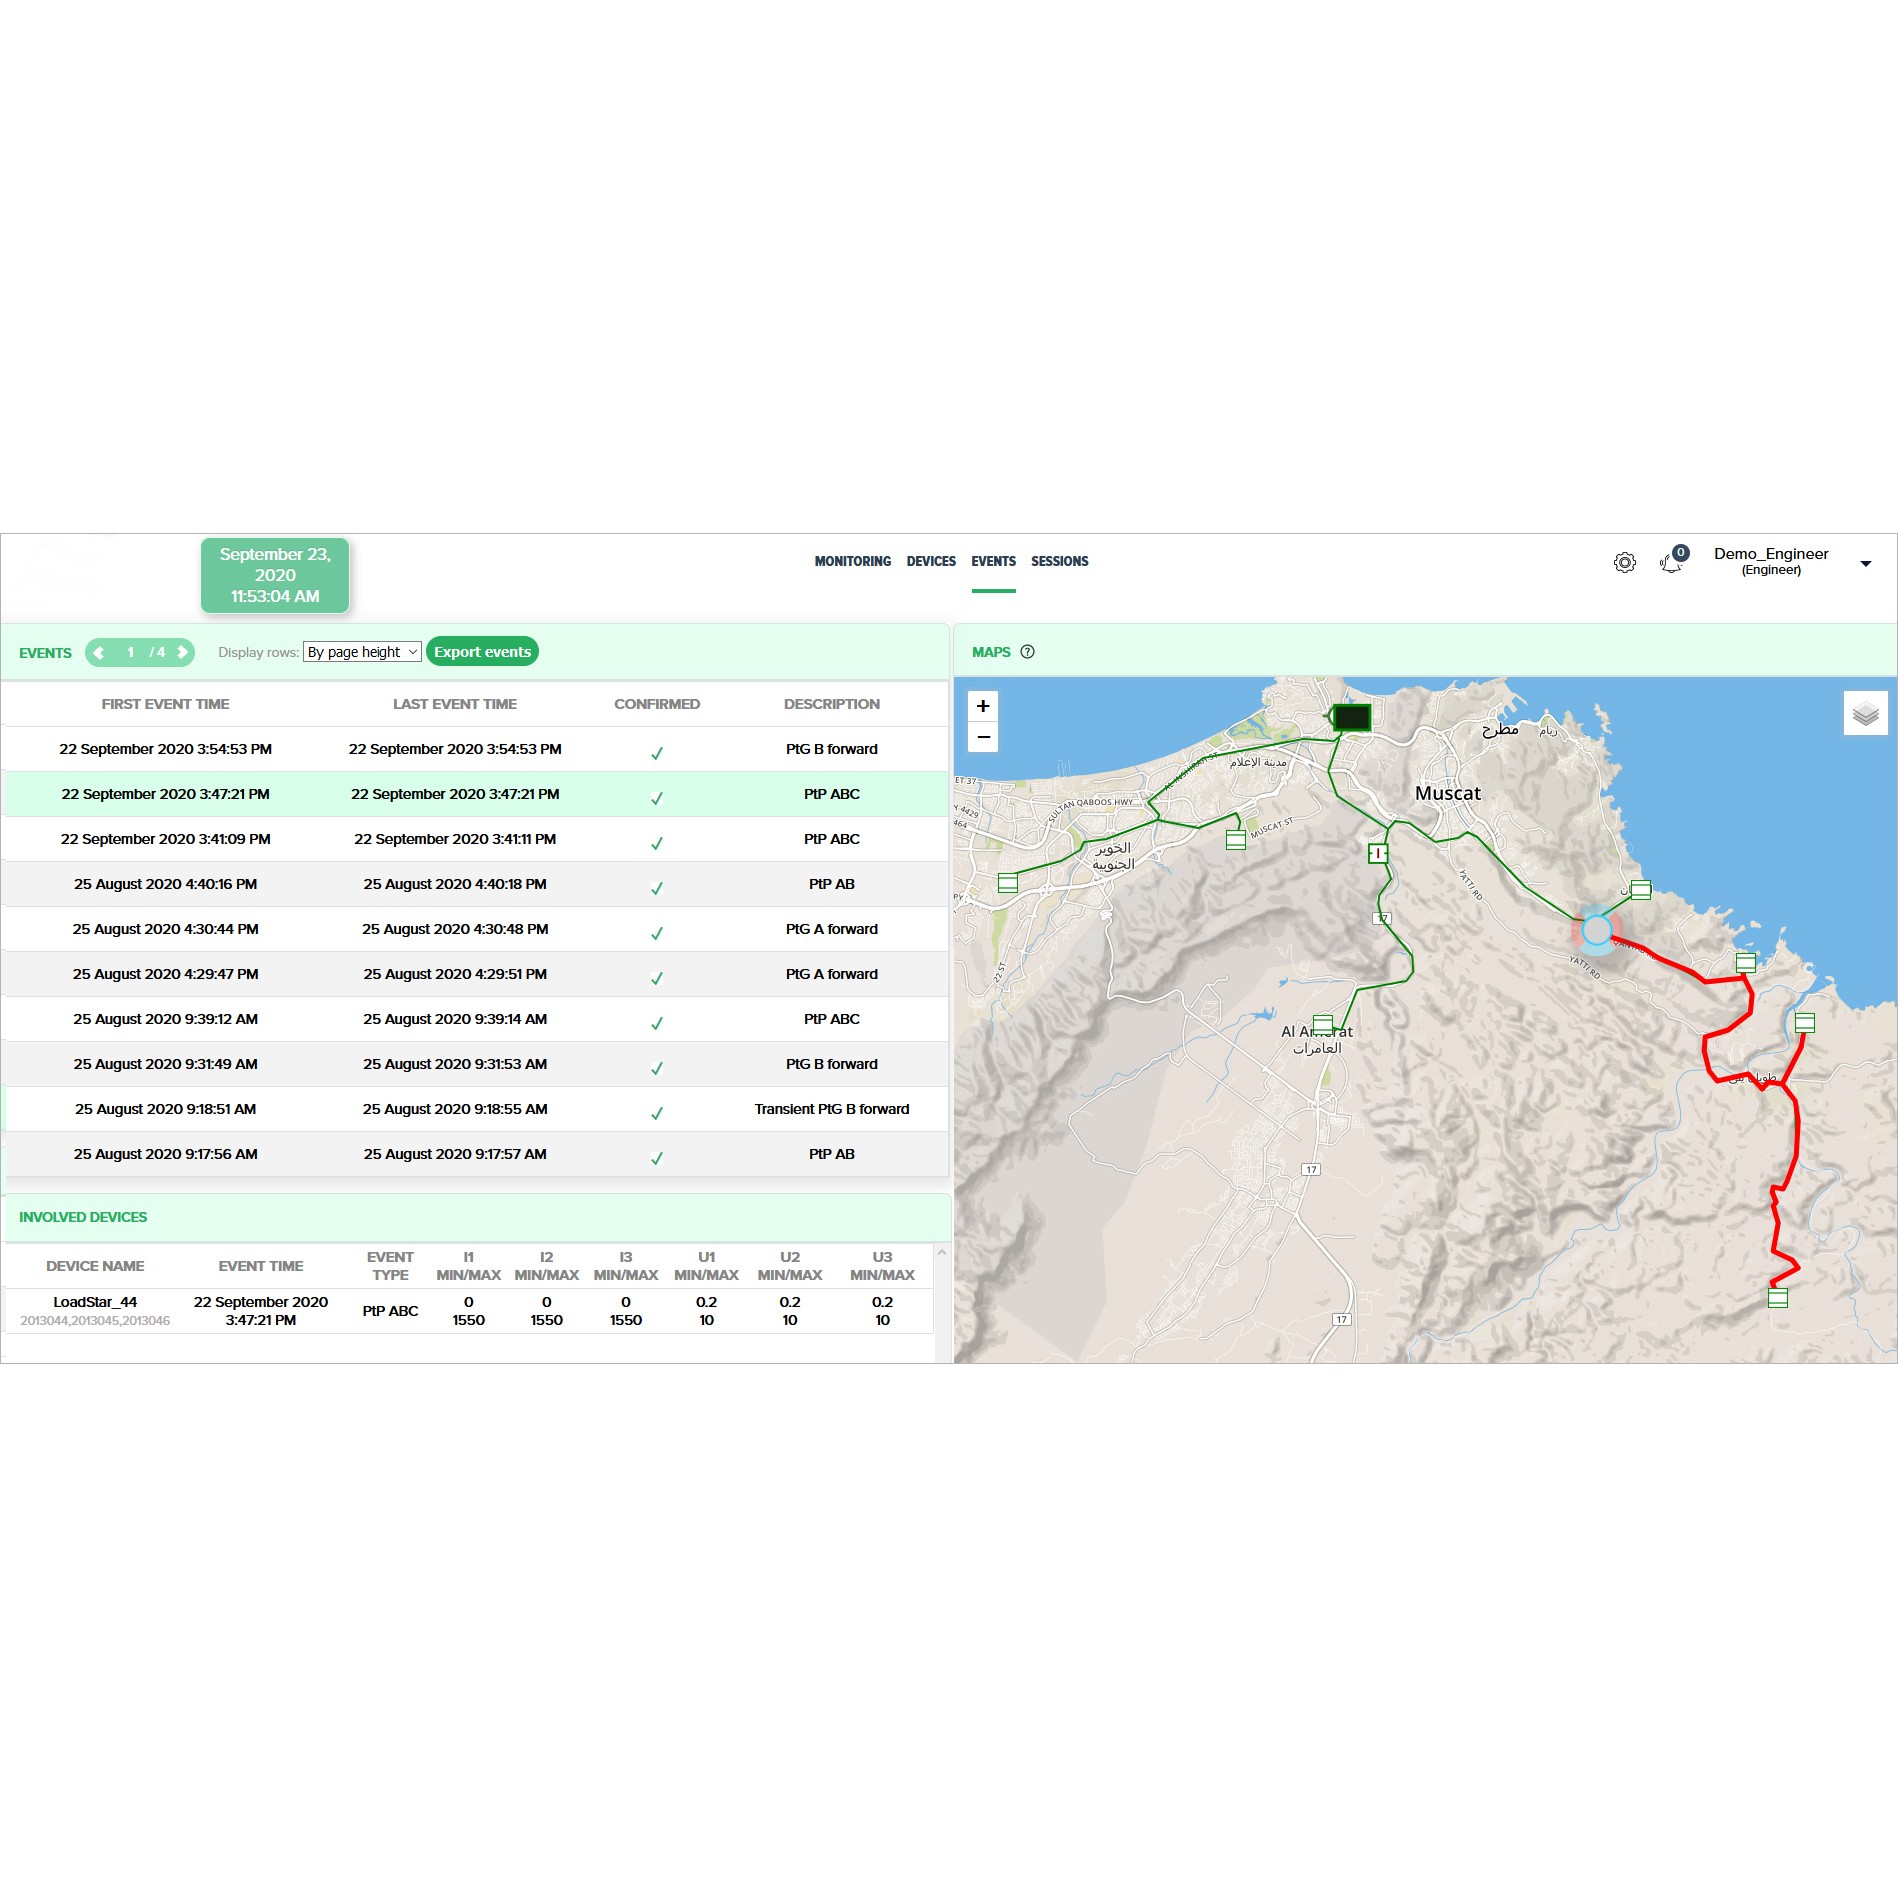
KOMORSAN 2 does not require changes in network infrastructure and uses cloud technologies for collecting and analyzing information. Observing the power grid layout on a topographic map with the location of monitoring devices included in the System materially lighten the work of a power system operator. Neural microservice detects the area of overhead line at which a fault has taken place and type of the fault.
The System has inbuilt cybersecurity facilities and stores user activity information in the electronic logs. To work with the program, the user access basic levels are provided: manager, engineer, administrator. Data exchange with the SCADA system is carried out via IEC 60870-5-104 and IEC 61850 protocols.
The modular design of the KOMORSAN 2 system enables customers to tailor the monitoring system meeting their own requirements: to deploy all modules of the KOMORSAN system, or to integrate data collecting and processing server KOMORSAN to existing SCADA. Large number of Lodestar fault indicators, feeder monitors and intelligent disconnectors can be monitored from a single KOMORSAN’s server. All communication links are 100% controlled and any problems are noti?ed in the System immediately.
The system consists of two key components:
1. KOMORSAN 2 data collecting and processing server. Lodestar modi?cations which are equipped with GPRS modules, establish a TCP/ IP connection for data exchange. Cable fault locators can transmit data to KOMORSAN 2 server via Modbus or IEC 60870-5-104 protocols.
2. The KOMORSAN Web Client software application for monitoring of distribution networks provides access to data collected from diagnostic devices which are equipped with communication modules. This software has geolocation tools that enable a user to control power lines with installed monitoring devices. Based on the network topology and fault information from indicators the KOMORSAN Web Client software visually demonstrates the information, which the operator to easily identify the fault location and its type.
KOMORSAN benefits:
- High level of usability, works with most operation systems;
- Sends fault information directly to maintenance crews via SMS and e-mail (optional);
- Can be integrated with a third-party SCADA system;
- Enables control of the status of installed Lodestar FCIs on a map;
- Easy to implement and easy to manage;
- Fast device setup;
- Simple configuration;
- Cost-effective;
- Immediate and reliable fault localization;
- Web browser-based user-friendly interface;
- Smart analysis and diagnostic tools;
- Remote firmware upgrades;
- Guaranteed technical product support 24/7;
- Secure access;
- Data export;
- Network topology mapping.
| PARAMETER | VALUE |
| System components | |
| Data collection and processing | Server-based solution |
| Web-application | Browser-based software solution |
| Functionality | |
| Fault registration | • Type of fault • Phase of fault • Transient fault • Direction (Lodestar CL0.5 in isolated grids) • Registration time • Fault currents • Triggered indicators |
| Grid topology | • Map with electricity objects • Localization of damaged section • Fault direction (Lodestar CL0.5 in isolated grids) |
| Telemetry | During regular communication sessions: currents (10-15% accuracy), voltage (presence, absence, relative values) |
| Configuration of fault management devices | • Fault indicators • Communication equipment • Intelligent disconnector |
| Alerts | • E-mail • Sms • Sound and visual alarms |
| Registration journal | • Personnel sessions • Confirmation of events by the dispatcher |
| Roles | |
| Dispatcher | • Events monitoring • Alerts |
| Engineer | • Events monitoring • Alerts • Access to sessions • Devices configuration |
| Admin | • Events monitoring • Alerts • Logs of personnel actions • Devices configuration • Managing user’s accounts and roles • Downloading personnel’s actions • Map edition |
| System requirements | |
| Requirements to server | Rack mounted platform 1U 4-core CPU; 3.5 GHz, RAM – 16 Gb, 1TB ROM RAID1, external RAID controller |
| Web-server OS | Linux |
| Web-client OS | Any devices and OS (browser based) |
| Integration with third party’ SCADA | |
| Integration protocol | IEC 60870-5-104 |